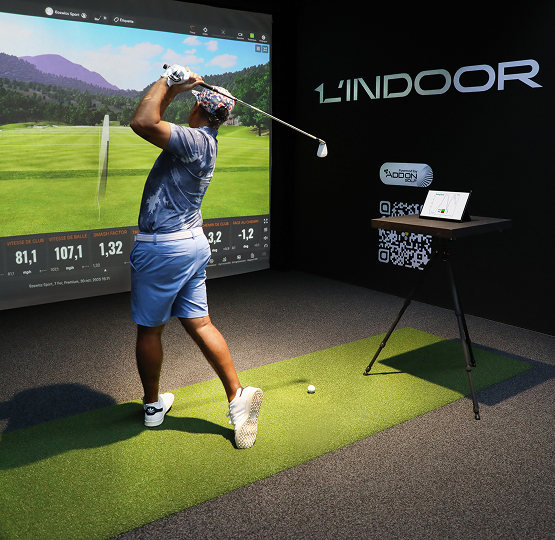
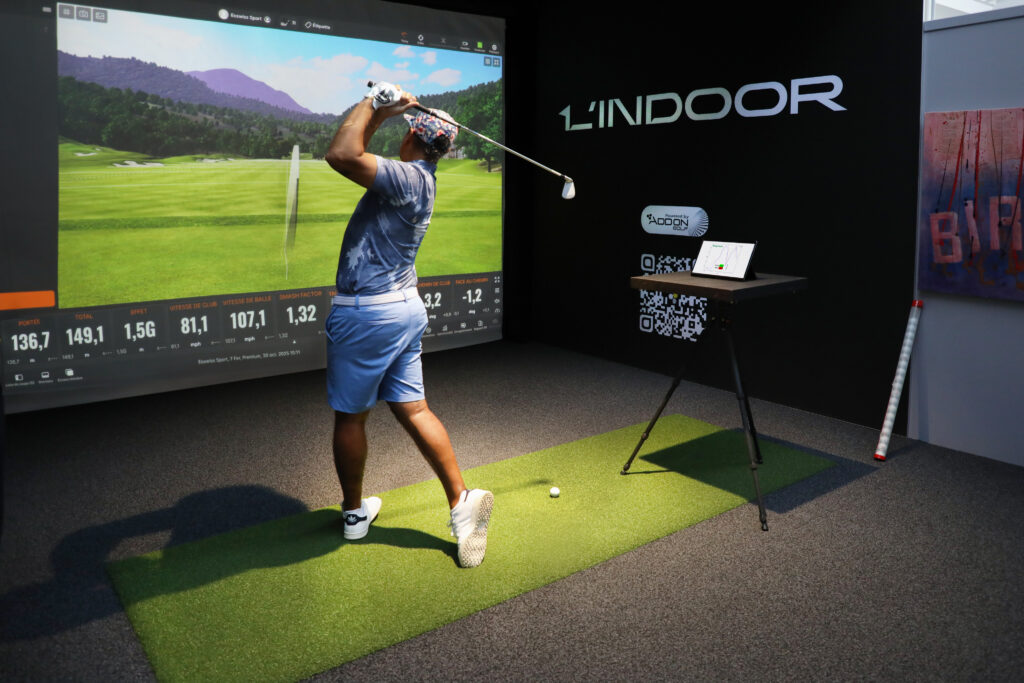
Most indoor golf centers already have launch monitors, simulators and coaching programs.
Offer premium player assessment, club fitting insights powered by grip pressure analysis. This is a world new indoor & outdoor golf technology.
Merge grip pressure data with launch monitor data for premium coaching and performance programs.
The market is changing. Most centers now offer:
すべてのゴルフスイングやパットにおける手と指の力の発達を測定する。.
The hands are the final connection between the player and the club. All forces are transferred through the hands to the club.
Immediate analysis of every swing and how you improve further. The improvement path is your personalized way, taking into acvcount that everybody has a specific, personal “swing signature”.
You improve consistency & accuracy in swing movement, force development and hence shot consistency.
すべてのゴルファーには個人の “スウィング・シグネチャー”. それはあなた自身のスイングの仕方(他の誰のものでもありません)です。それは、どのようにプレーを学んだか(例えばコーチ)、あなたの生体力学的特性(身長、腕の長さ、筋力など)、トレーニングの頻度など、いくつかの要素によって決まります。.
これがエリートゴルファーのスイングの数例です。約50のスイングのシリーズからのものです。彼らがどれほど一貫しているか分かりますか?それは 常に 同じ形です。それは 常に インパクト時の同じ特徴。.
スイングは上下に平行にずれていますが(その結果、距離がわずかに長くなったり短くなったりします)、スイングのパターンや指にかかる力は非常に再現性が高く、常に同じです。.
私どもの楽器を使えば、まさにこの一貫性を鍛えることができます。以下の成果が得られます:
You traini force development, timing and sequence
手の動きのばらつきが少なければ、結果のばらつきも少なくなります。.
正しいグリップの強さの形を通したクラブフェースの向きとインパクトのタイミング
手の力が結果を決める。手のコントロール=結果のコントロール。.

Our system complements your existing investment
スイングおよびパッティング中の手の圧力を測定、分析、改善します。「世界平均」のゴルファーではなく、あなたにぴったり合う1つのモデルに、手の圧力データ、ローンチモニター、地面反力データを統合して強力なモデルを構築します。.
各ゴルファーの全体像とそれぞれのスイングの特徴を活かして、個別のレベルアップに活用しましょう。.
屋内または屋外を使用してください。.
Business use:
Business use:
Business use:
Business use:
Business use
Business use
スイングやパッティング時の手の力を測定、分析、改善します。手の力のデータと、ローンチモニターおよび接地力のデータを1つのモデルに統合し、強力なモデルを構築します。.
各ゴルファーの全体像とそれぞれのスイングの特徴を活かして、個別のレベルアップに活用しましょう。.
屋内または屋外を使用してください。.
Business use:
Business use:
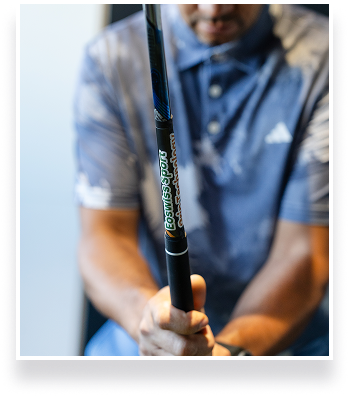
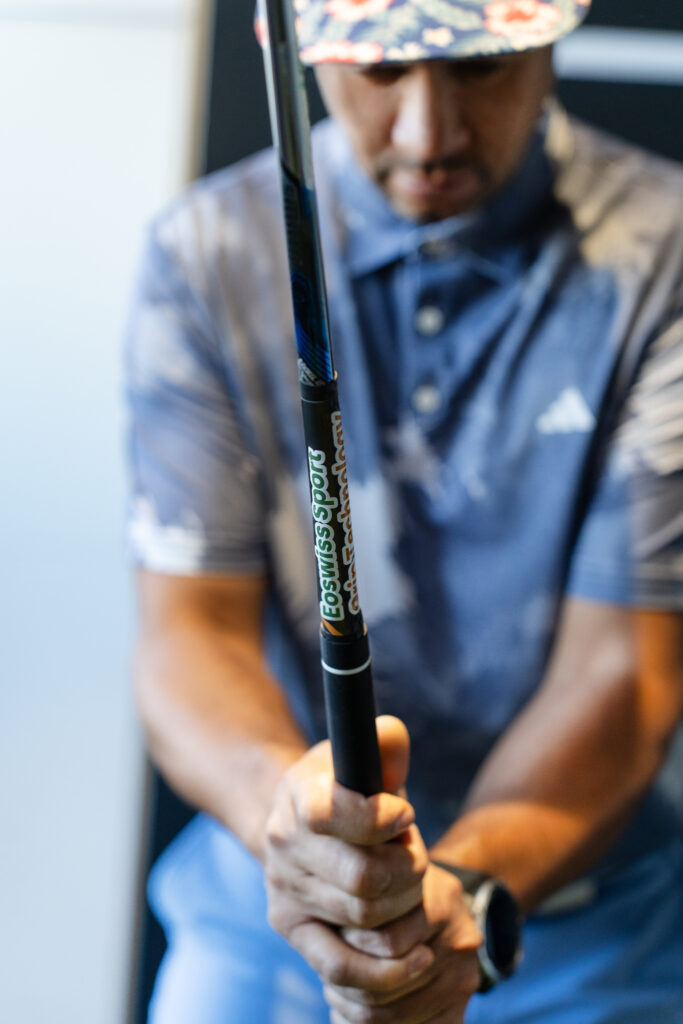
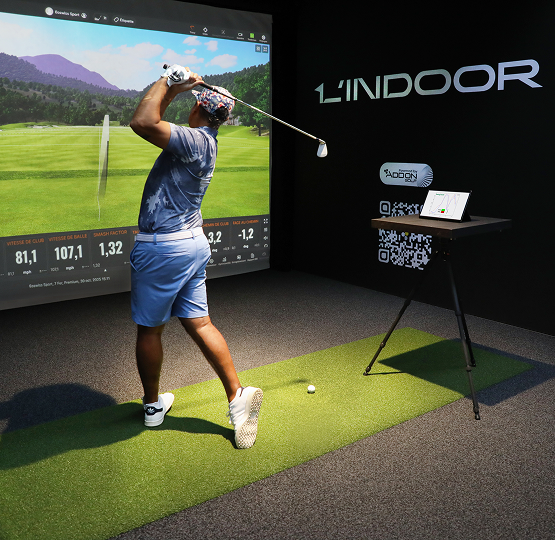
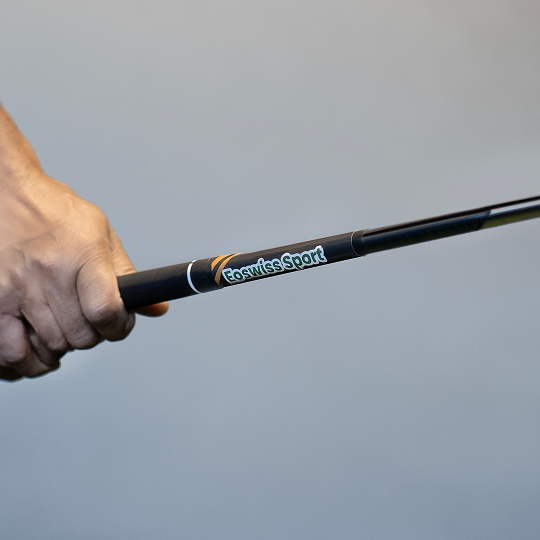
The whole rubber grip is your sensor. Position and forces of fingers and hand balms are measured and transmitted (no wires) to the tablet.
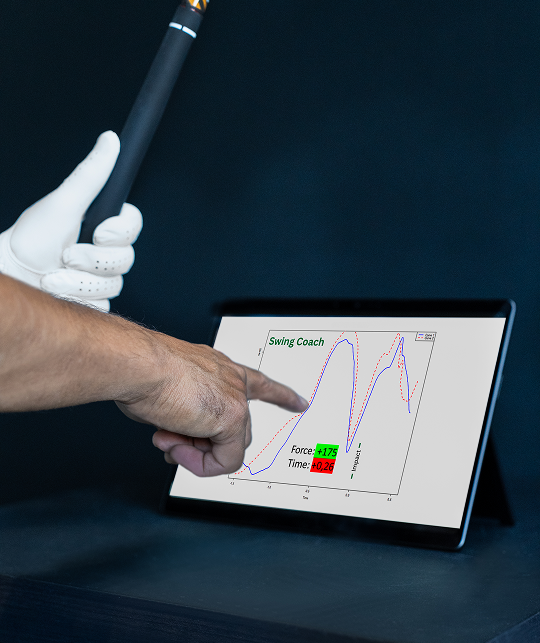
You see your swing results immediately on the tablet. But can analyze much deeper than that. All data are stored and are ready for a structured analysis later on.
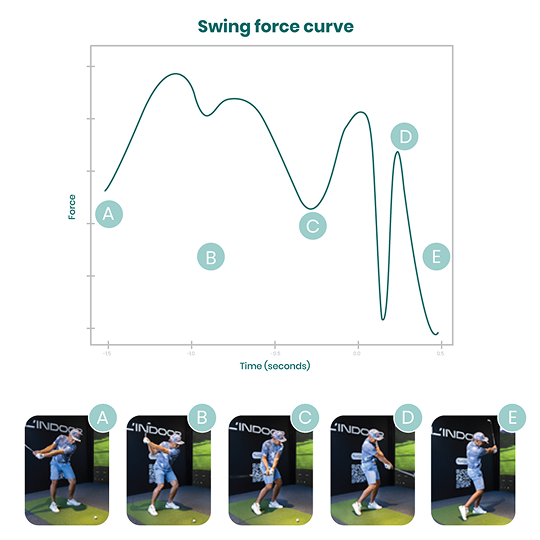
Example Curve
A “total force “ curve is shown in the graph. This curve represents the sum of both hand forces on the grip.
Backswing phase: every golfer has a very personal “swing signature”
手の動きのばらつきが少なければ、結果のばらつきも少なくなります。.
The peak between C and D. Here your hands decide…
Follow through, finish. Important information about your biomechanics.
We say: Your hand forces determine to a large extent how you transfer your energy to the club. Your hand force determine to a large extent your result.
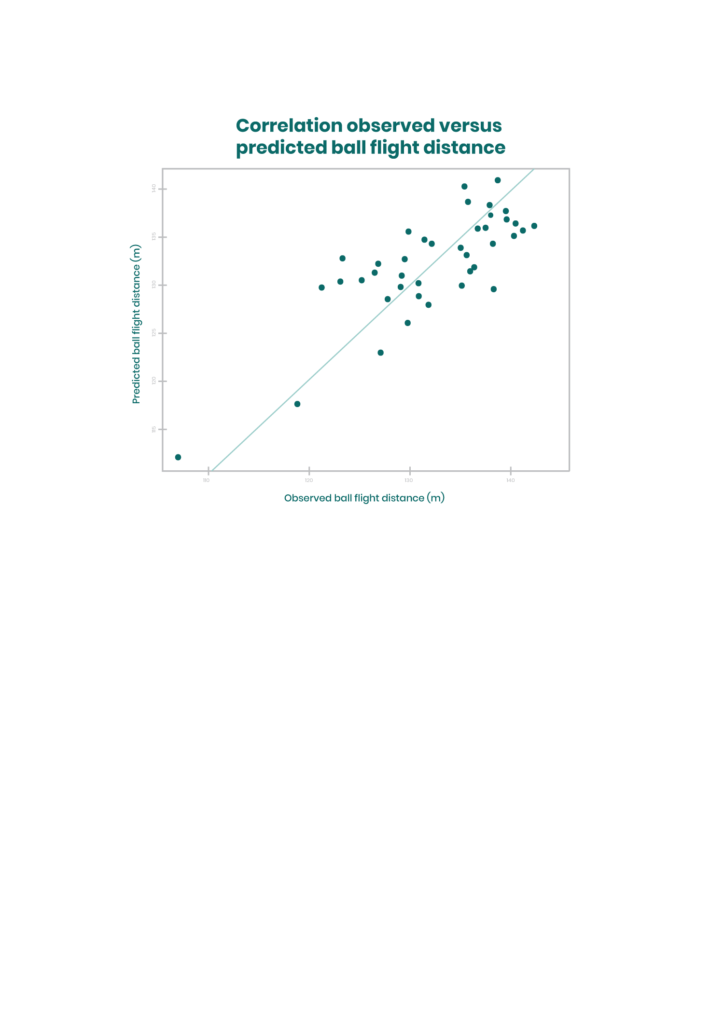
it must be possible to predict the swing result (= ball flight) from hand force measurements. Is this true?
The Graph shows the relation between observed (real) ball flight distance to predicted ball flight distance. And indeed, we see predictions from hand force measurements predict the swing results. Every point in the graph represents a swing.
There is scatter in the data- yes! But regarding that no other information (e.g movement, ground force ) were used, the correlation is remarkably good.
Launch monitors measure the results.
We measure the reasons.
Measures
Measures
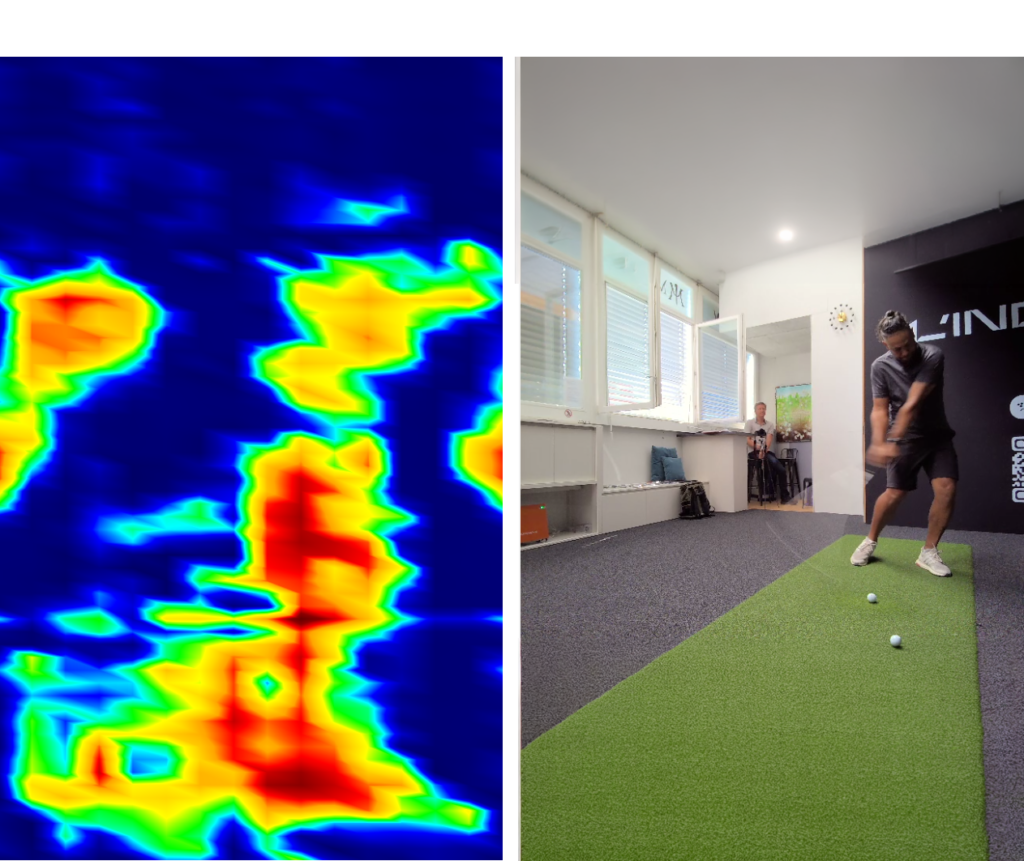
Presure map of a professional golfer at impact (left). The pressure map is an image of the complete grip surface. iron side of grip on top.
Video at impact (right).
Golfers often hear:
But what does this actually mean?
Pressure mapping transforms subjective coaching into visual feedback players can understand immediately.
The result is higher engagement, stronger motivation and better retention
We work with several golf coaching center and golf clubs in the Geneva region.
Join us for a test.
Or, connect for a online test and demonstration via a video call.
あるいは、御社の会場で開催されるイベントに弊社をご招待ください。.
We transferred our life science precission engineering know how into golf technology.